Top Salesforce Spring '22 Features (Part- 1)
- Hasti Davda

- Dec 31, 2021
- 9 min read

Salesforce's Spring '22 release notes are out and we cannot wait to show you what Salesforce has in store for all of us. We have created a list of top releases part 1. Part 2 is coming soon your way.
Let's dive right into what these features are;
Allow Einstein to prototype your data Consent of the Pilot
Allow Salesforce data scientists to prototype and explore your data so you can work more efficiently. Keep track of where your clients' attention is drawn. When consumers search for information or use an app, for example, services can analyze what customers are looking at and identify patterns in order to better sell their material. Allow access to only the programs and items you specify. Just tell us what data you want us to look at, and we'll take care of the rest.
Where: This modification affects the Professional, Enterprise, Performance, Unlimited, and Developer editions of Lightning Experience.
Who: Administrators who are part of an Einstein pilot program can use this functionality.
How: In the Quick Find box in Setup, type Einstein Pilot Consent. Make changes to the settings for the programs and objects to which you want to provide access.

Where Should Your Prompts Appear?
You may now select the page and app where your prompt or guide will appear. Previously, the only option for in-app guidance was to build it for a specific page and app.

Where: This modification affects the Essentials, Professional, Enterprise, Unlimited, and Developer editions of Lightning Experience.
How to: From Setup, type In-App Guidance into the Quick Find box, then pick In-App Guidance.
Select a prompt location from the Prompt Location selection as you build a prompt or walkthrough.
Data from Tableau CRM and Data Pipelines can be combined.
Are you tired of having to recreate Tableau CRM recipes in Data Pipelines every time you want to generate the same dataset? You can now pick which product's limits a recipe's run and dataset will use when utilizing both Tableau CRM and Data Pipelines. To avoid having to recreate and update recipes in both products, you can use the datasets from either product as inputs when constructing recipes. With revised recipe and dataset monitor pages, you can also keep track of recipe and dataset product relationships.
Where: When using the new Data Manager, this change affects Tableau CRM in Lightning Experience (beta). Tableau CRM is available in Developer Edition as well as Enterprise, Performance, and Unlimited licenses for an additional fee. Salesforce Data Pipelines in Lightning Experience are also affected by this change. Salesforce Data Pipelines is an add-on feature offered in the Enterprise, Performance, and Unlimited editions for a fee.
Who: Users who have both a Tableau CRM and a Data Pipelines license are eligible. Government Cloud customers do not have access to Data Pipelines.
How: Select the product when saving a recipe for the first time, as this dictates which limitations and queues are used, as well as which people have access to the data. A recipe connected with Data Pipelines, for example, uses your org's given monthly task runtime for Data Pipelines, and its dataset isn't available to Tableau CRM users unless they also have a Data Pipelines license.

Add the dataset as an input node in another recipe to use data from a Tableau CRM or Data Pipeline recipe.
Tableau CRM's new Data Manager, which is currently in beta, assists you in managing and tracking the product linked with recipes and datasets.

Sort the recipes by-product (1) or modify the association with the recipe's License option on the Recipes tab (2).
View the data linked with each product using the product dropdown on the Data Assets tab.

With Dynamic Gauge Charts, you can automatically tune your dashboards to your business goals (Generally Available)
Dashboard gauge charts are useful for keeping track of your performance and business objectives, but your company is continually changing. You're no longer bound by static goals or performance levels using dynamic gauge charts. Create a gauge chart with report metrics and field values that respond to your business dynamically. A gauge chart, for example, can demonstrate how a subsidiary's sales compare to your total firm.
Where: This modification affects the Group, Essentials, Professional, Enterprise, Performance, Unlimited, and Developer editions of Lightning Experience.
How: Select Standard or Dynamic mode when adding a gauge chart to the dashboard builder. The gauge chart is created in Standard mode using fixed values. You can control the chart measure, which is shown by the pointer, and the chart target, which is the chart's maximum value, in Dynamic mode.
In Data Manager, you can see your data at a glance (Beta)
Data Manager has a new appearance. You may now see connections in a column list in Data Manager's simplified Connections view.

When you click on a connection, you'll get further information. We've improved visibility into your usage and restrictions in the new Usage view.
Where: Tableau CRM is available in Developer Edition as well as Enterprise, Performance, and Unlimited licenses for an additional fee.
How: Select Data Manager (Beta) from the Analytics Studio home page to access Data Manager.
The details of a connection appear in the right pane as a table.

The Usage window can be used to identify if a product is approaching its limit. If you have Tableau CRM and Data Pipelines licenses, use the option to move between the information for each product.

With Auto-Layout, you may automatically place flow elements (Generally Available)
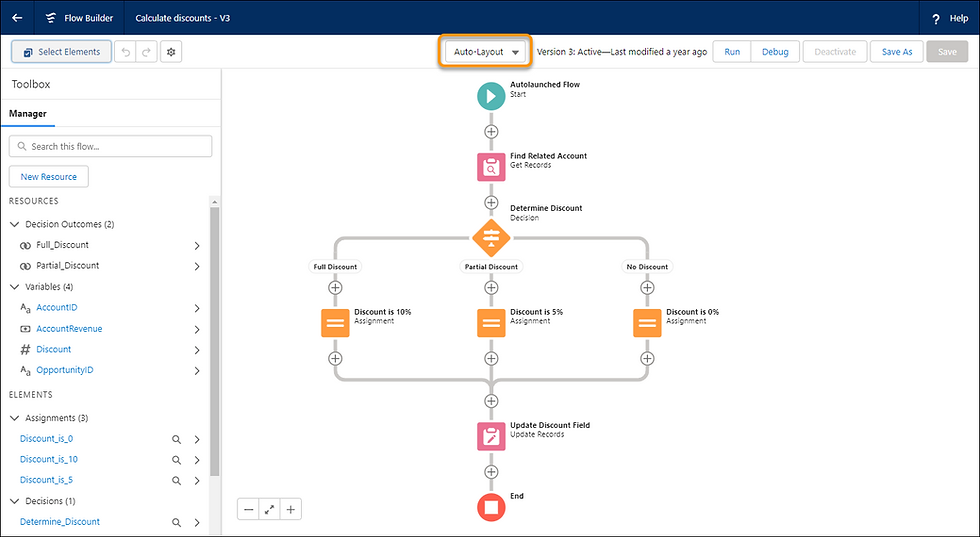
Auto-layout makes it easy to create flows and align pieces. Elements on the canvas are automatically spaced, connected, and aligned, saving you time and keeping your canvas tidy. The default canvas layout for flows is now auto-layout. In auto-layout, user templates are now also available.
Where: This change affects Salesforce Classic and Lightning Experience in the Essentials, Professional, Enterprise, Unlimited, and Developer editions.
How: Select Auto-Layout from the dropdown menu to switch between auto-layout and freeform. To add an element, click the Add element icon next to the location where you want it to run. The options and possible items for that place are then displayed by Flow Builder.

Click an element to modify, copy, or delete it.

After you've copied an element, click the Add element icon to place it where you want it. Then select Paste Copied Elements from the drop-down menu.

A group of items can also be copied and pasted to another location.

Select Elements (1), then select one element by clicking the Select element icon on each one (2). Click the Copy elements icon to copy the elements (3). To paste, select the relevant position and click Add element icon, then Paste Copied Elements.
In Data Prep, set your fiscal year.
Analyze your Tableau CRM data by fiscal year without affecting the rest of your organization or performing manual tasks. In Data Prep, define your fiscal year and it will be applied to your Data Prep data automatically. Previously, the fiscal month offset attribute in each dataset's JSON had to be changed. This feature is only available for organizations that haven't set an org-wide custom fiscal yr in the company profile.
Where: Tableau CRM in Lightning Experience and Salesforce Classic are also affected by this change. Tableau CRM is available in Developer Edition as well as Enterprise, Performance, and Unlimited licenses for an additional fee. Salesforce Data Pipelines in Lightning Experience are also affected by this change. Salesforce Data Pipelines is an add-on feature offered in the Enterprise, Performance, and Unlimited editions for a fee.
How: Enter Analytics in the Quick Find box under Setup, then select Data Prep Settings (1). By turning the toggle On, you can enable Fiscal Year Configuration (2)

Salesforce Help: Data Prep’s Fiscal Year Configuration (can be outdated or unavailable during release preview) Salesforce Help: Date Formats and Fiscal Dates for Source Data (can be outdated or unavailable during release preview)
Improved Forecasting Saves Time
Time series forecasting in Data Prep now handles the heavy lifting for you—no more manually aggregating measures for forecasting. You can also pick multiple groupings in one node, such as forecasts for each account. You had to manually aggregate and group data in distinct nodes previously.
Where: Tableau CRM in Lightning Experience and Salesforce Classic are also affected by this change. Tableau CRM is available in Developer Edition as well as Enterprise, Performance, and Unlimited licenses for an additional fee. Salesforce Data Pipelines in Lightning Experience are also affected by this change. Salesforce Data Pipelines is an add-on feature offered in the Enterprise, Performance, and Unlimited editions for a fee.
How: Select Time Series Forecast is a transform node in the Data Prep editor to use the improved time series forecasting.
During data preparation, embed multiclass predictions in your dataset.
The Einstein Discovery multiclass models, which predict the most likely outcome among up to ten alternative outcomes, are now supported by the Discovery Predict transformation for Data Prep recipes. Use a multiclass model to forecast which support contract level a new customer will likely acquire, for example, if you offer five support contract levels. Einstein calculates and saves expected outcomes to the prediction output field on a row-by-row basis when you run a recipe with a Discovery Predict transformation.
Where: Tableau CRM in Lightning Experience and Salesforce Classic are also affected by this change. Tableau CRM is available in Developer Edition as well as Enterprise, Performance, and Unlimited licenses for an additional fee. Salesforce Data Pipelines in Lightning Experience are also affected by this change. Salesforce Data Pipelines is an add-on feature offered in the Enterprise, Performance, and Unlimited editions for a fee.
How: Select the prediction definition associated with the multiclass model you want to employ in the Einstein Predict node of your Data Prep script. After that, preserve the prediction output field name and label.

With the new Customer Insights Pipeline Trending Waterfall Chart, you can better understand your pipeline.
You can now examine specifics about the offers and alter your planning to fulfill your quotas, regardless of whether your pipeline is trending up or down.
The new Customer Insights Pipeline Trending Waterfall Chart displays the pipe's start and end values, as well as what has been moved in and out. You may also view where each opportunity, including fresh, closed-won, and closed lost, is in the pipeline.
How: The Customer Insights Opportunity Gallery page now has a new Pipeline Trending Waterfall visualization. To use it, go to Tableau CRM Analytics Studio, click Create, and then choose App from the drop-down menu. Customer Insights can be found and selected. Then, to create your app, simply follow the wizard's instructions. If you already have a Customer Insights app, you'll need to update it to see the new features. To upgrade your app, go to the main page and select New version available, then follow the wizard's directions. Customizations are lost when an app is upgraded.
Salesforce CDP Data: Unlocking Insights (Generally Available)
View actionable insights on CDP data in embedded dashboards for any Salesforce record with Tableau CRM Direct Data for Salesforce CDP. Without relocating, prepping, or creating live datasets, you can get started using Tableau CRM Direct Data for Salesforce CDP.
This functionality, which is now universally available, has been improved since the last release. Without a live connection, you can investigate CDP objects in Tableau CRM dashboards.
Where: Tableau CRM in Lightning Experience and Salesforce Classic are also affected by this change. Tableau CRM is available in Developer Edition as well as Enterprise, Performance, and Unlimited licenses for an additional fee.
Who: Users with a Salesforce CDP license can access Tableau CRM Direct Data for Salesforce CDP.
Why: Let's assume your dashboard displays case management data for service agents. Include metrics from CDP data, such as customer behavior insights, in the same dashboard to supplement Tableau CRM's analysis.
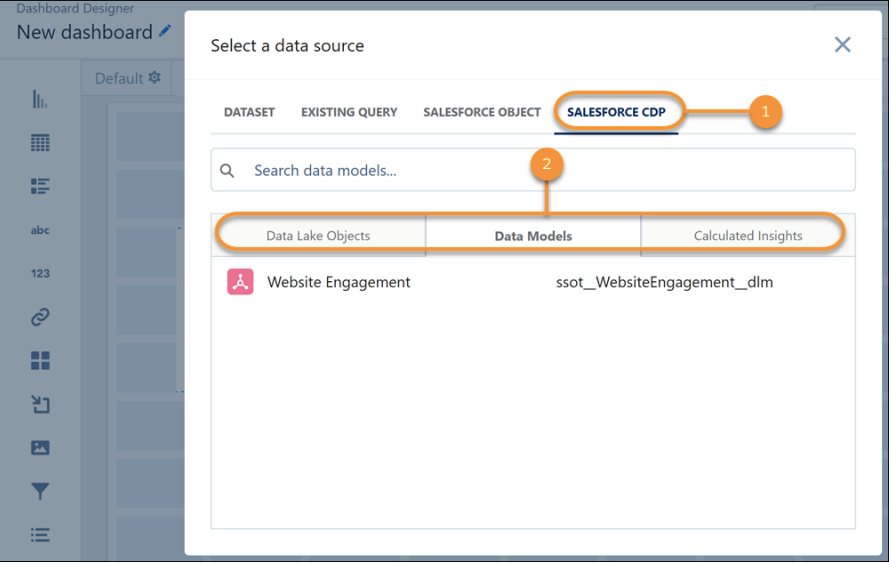
How: Create a query in the dashboard builder and select Salesforce CDP as a data source (1). Choose a data lake object, a data model, or a computed insight from the drop-down menus (2).

The CDP data table that appears can be explored and visualized.

On the Report Run Page, you can edit many fields inline (Beta)
You can now change statuses and clear up data without having to restart your reports. Editing several entries inline on the report run page saves time while keeping you up to date. Make inline changes in many rows or columns, then save them all with one click. It's a great approach to tidy up data or update several statuses without having to redo your report.
Where: This modification affects the Group, Essentials, Professional, Enterprise, Performance, Unlimited, and Developer editions of Lightning Experience.
How: From Setup, type Reports and Dashboards in the Quick Find box, then select Reports and Dashboards Settings. Save your modifications after selecting Enable Inline Editing in Reports (Lightning Experience only).
Open the report now. Any field that has a pencil icon when you hover over it can be edited. When you make a modification, the background color changes to show that a new value has been saved. Additional fields can be changed in the same row or in a distinct row.

A lock icon indicates that the field is not editable inline.

When you modify a field in a record that has related fields, the other fields are marked as Pending. The associated fields are updated with the new value when the modifications are saved. An opportunity report with an account name change is shown in this example. The Employees value is shown as Pending because the number of employees for an account is linked to the account name.

These features are designed to make the over business performance smooth, effective, and much more productive. If you are looking to enhance and boost your company or organization's operations, get in touch with us. Our exceptional team at Apphienz will make sure to help you implement these features seamlessly. Visit our website for more information and get in touch with us in case you have any further questions.


Comments